Both right- and left-wing sources are peddling a false narrative that California is awash in unheard-of crime and drug abuse, worse than anywhere else, and liberal reforms and prosecutors are at fault. These blatant distortions, perpetuated by Fox News (Perino, 2024), the Heritage Foundation (Colton, 2023; Males, 2023), Riverside County Sheriff Chad Bianco (Miller, 2024), The Young Turks (Kasparian, 2024) and many others, recite inflammatory anecdotes, quips, and selective, deliberately misleading “statistics” from anti-reform entities. This report is the first of a series that challenges these deceptions by presenting comprehensive data from standard sources.
Reforms Did Not Bring More Crime. Rates Are Near Record Lows
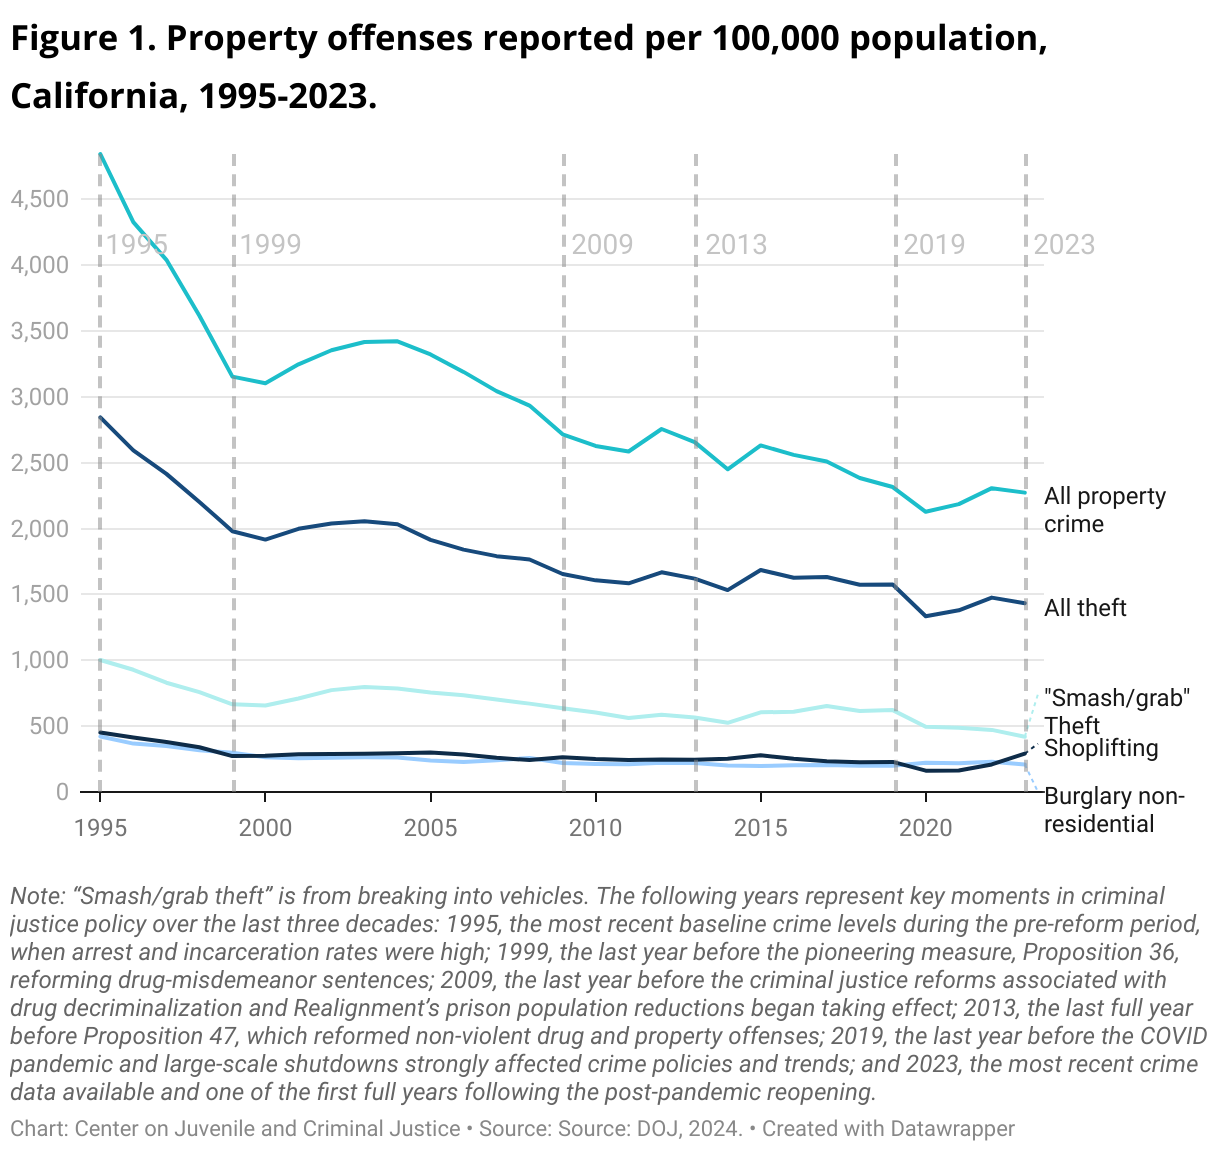
- California’s Part I property crime rates declined during a period of transformative reform.
Statistics released this month by the California Department of Justice, clearly show that property crime rates now stand near record lows following a period of major criminal justice reform that includes Public Safety Realignment (2011), Proposition 47 (2014), and Proposition 57 (2016). Figure 1 shows 29 years of the latest California Department of Justice data (DOJ, 2024) for five relevant offenses as reported by more than 98% of the state’s law enforcement agencies. The data show that property crime rates have fallen by 53% since 1995 (DOF, 2024). Part I property crime, which mostly consists of felonies, declined by 13% from 2009 through 2023, the criminal justice reform period.1 After a brief uptick in 2015, the types of crime most affected by Prop 47’s reforms2 generally fell through 2019, a period when Prop 47’s effects should be most visible. After 2019, COVID disruptions have interfered with crime trends, as have changes in policing strategies and priorities.
- 2023 crime statistics are muddled by recent political, social, and administrative changes.
Several factors complicate recent data reporting and may have inflated 2023’s already-low property crime statistics. These include the end of COVID-19 restrictions, which had temporarily suppressed most types of crime; a change in how police agencies report data to the FBI, which may have boosted rates for certain low-level offenses; evidence that some police agencies over-reported statistics (Echeverria, 2024); and an effort by retailers and law enforcement interest groups to portray California as a hot-bed of retail theft, which may have affected reporting for certain property offenses such as shoplifting.
The first major complication, the COVID pandemic and related public restrictions accompanied reductions in crime (other than homicide and assault) in 2020 and 2021, followed by a rebound as the state reopened in 2022 and 2023. The second, also important, is law enforcement’s gradual phase-in of the FBI’s (2024) new National Incident-Based crime reporting standard (NIBRS), which allows agencies to report multiple arrests or offenses within a single incident (such as a theft that occurred during an assault), thus boosting numbers for lesser crimes such as property and drug offenses. California agencies have been slowly phasing in the NIBRS, which increased crime and arrest numbers for 2021, 2022, and 2023.
Further, there is evidence of changing reporting and police priorities for certain offenses that receive a lot of publicity and political attention, such as retail thefts, which are categorized as shoplifting or commercial burglary.3 The large increases in reported shoplifting (but not non-residential burglary) occurring after 2020 may be due, in part, to police and retailers’ more organized attention to this offense, particularly in urban areas. This period has coincided with sharply increased press coverage of shoplifting incidents, a spate of store closures,4 and fierce debate over the fate of Proposition 47 (CRA, 2023; see also Little Hoover Commission, 2024).
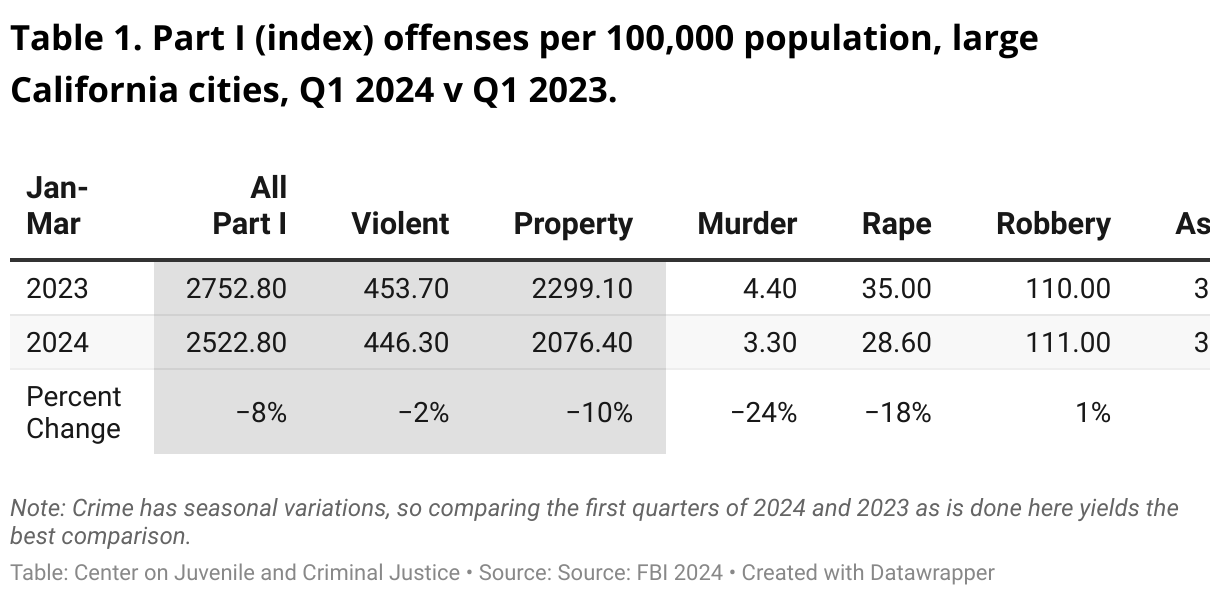
- These downward trends are continuing into 2024, with declines in nearly every crime category.
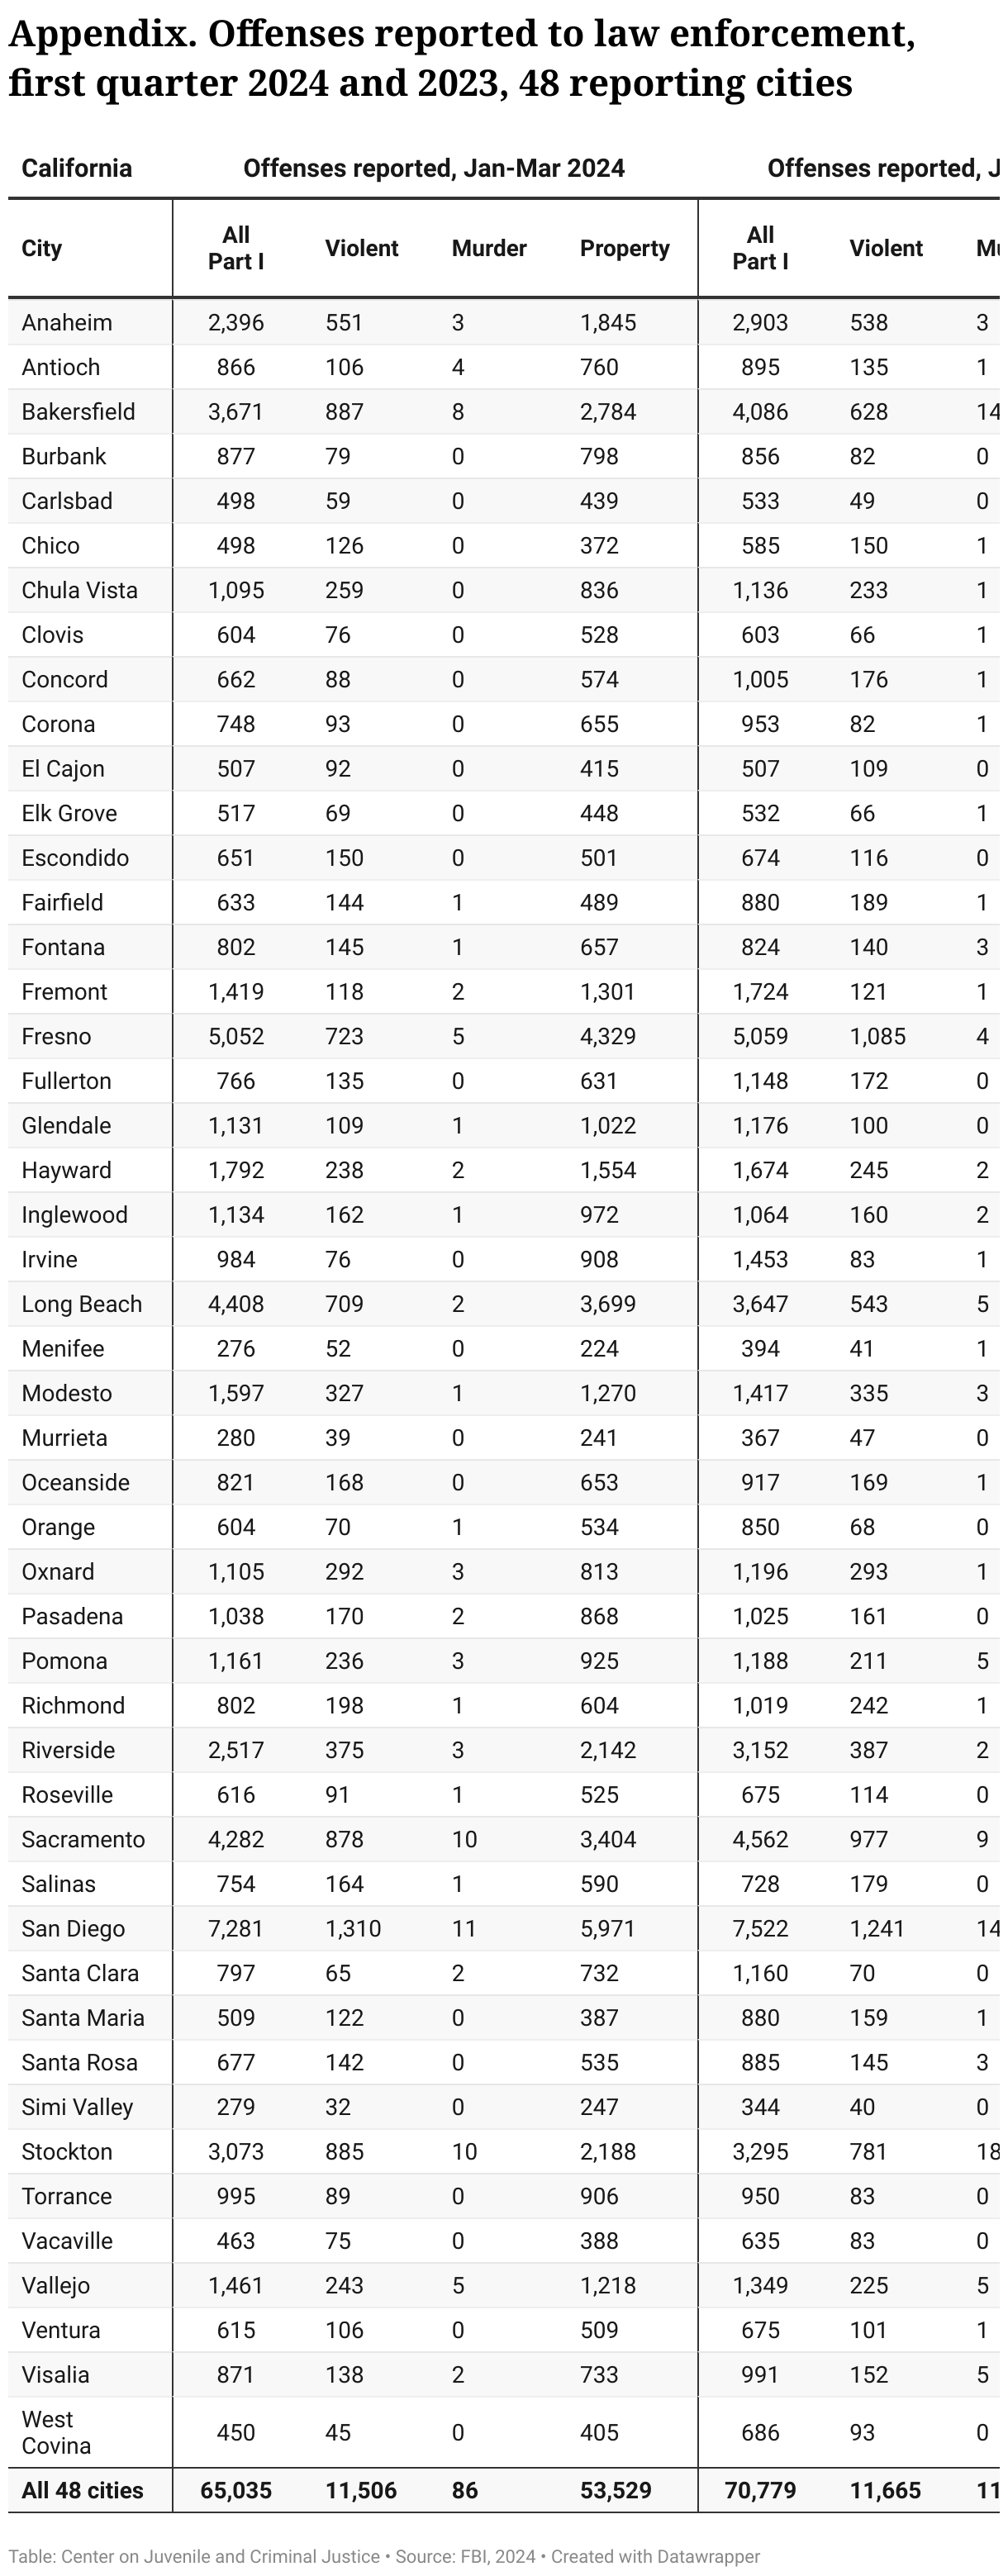
Opponents of reform, such as Fox News and The Young Turks, highlight cities and crimes that show increases, but the latest crime trends for 48 California cities5 show the opposite: continued large declines. The data show crime declines across almost every major crime category, including an 11% decline in theft and a 17% drop in burglary, in the first three months of 2024 compared to the first three months of 2023 (see Table 1). FBI quarterly crime tabulations, while not a complete picture of crime even for cities, have proven predictive of statewide trends in the past. Across the eight types of crime and 48 cities reporting them (384 total categories), crime rose in 124, fell in 232, and stayed the same in 28 — nearly twice as many crime declines as increases. Yet Fox, The Young Turks, and other outlets picked only the few cities and crimes showing the worst increases while ignoring the much larger number of cases where the opposite trends prevailed.
Crime statistics will always vary by offense, jurisdiction, and time frame. However, opponents of reform are falsifying crime issues to depict a nonexistent surge. In fact, California appears to be enjoying a period of historically low property crime. This has occurred amid transformative justice reform, reopening after COVID-19, and adopting a new statistics system.
References
California Department of Justice (DOJ). (2024). Open Justice. Crimes and clearances. At: https://openjustice.doj.ca.gov/exploration/crime-statistics/crimes-clearances.
California Retailers Association. (2023). Annual Report 2022. At: https://calretailers.wpenginepowered.com/wp-content/uploads/2022/10/CRA-Annual-Report-2022.pdf.
CapitalOne Shopping Research. (2024). April 9, 2024. Retail Theft (Shoplifting) Statistics. At: https://capitaloneshopping.com/research/shoplifting-statistics/.
Colton E (2023). Florida crime trending down while California skyrockets explained by one key difference: expert. Fox News, 30 October 2023. At: https://www.foxnews.com/us/florida-crime-trending-down-while-california-skyrockets-explained-one-key-difference-expert.
Echeverria D (2024). California report says violent crime is up statewide. Our analysis suggests that’s wrong. San Francisco Chronicle, 24 July 2024. At: https://www.sfchronicle.com/california/article/crime-violence-trends-19551608.php.
Federal Bureau of Investigation (FBI). (2024). Crime data explorer. Quarterly uniform crime reports. At: https://cde.ucr.cjis.gov/LATEST/webapp/#/pages/explorer/crime/quarterly. National Incident-Based Reporting System (NIBRS). At: https://www.fbi.gov/how-we-can-help-you/more-fbi-services-and-information/ucr/nibrs
Kasparian, A. (2024). Leaked emails show Gavin Newsom’s SLEAZY effort to win presidency. The Young Turks, 29 June 2024. At: https://www.youtube.com/watch?v=Sar0jsMXQTw&t=63s.
Little Hoover Commission. (2024). Retail theft: A data-driven response for California. July 2024. At: https://lhc.ca.gov/wp-content/uploads/Report_RetailTheft‑1.pdf.
Males, M. (2023). Right-wing comparisons of violence in “law’n’order” Florida vs “lawless” California are 100% phony. Daily Kos, 14 November 2023. At: https://www.dailykos.com/stories/2023/11/14/2205826/-Right-wing-comparisons-of-violence-in-law-n-order-Florida-vs-lawless-California-are-100-phony.
Matthews, A.L. & Wilson, R. (2023). Crime isn’t the full story: What else is affecting retailers in urban areas, in 4 charts. CNN. At: https://www.cnn.com/2023/10/12/business/target-closing-us-cities-crime-dg/index.html.
Miller, A.M. (2024). CA sheriff blasts Newsom’s ‘failed leadership’ on crime, proposes solution to fix ‘disaster’: ‘Had enough’. Fox News, 8 April 2024. At: https://www.foxnews.com/politics/ca-sheriff-blasts-newsoms-failed-leadership-on-crime-proposes-solution-fix-disaster?msockid=07c08f7d1ea768183a349b0e1f1d6994.
Perino, D. (2024). Crime in CA is getting so bad Newsom is being forced to take action. Fox News, 7 February 2024. At: https://www.foxnews.com/video/6346437280112?msockid=07c08f7d1ea768183a349b0e1f1d6994.
Note: On August 14, 2024, CJCJ updated this report‘s title to reflect our new series that challenges misinformation on California’s public safety trends.
Please note: Jurisdictions submit their data to the official state or nationwide databases maintained by appointed governmental bodies. While every effort is made to review data for accuracy and to correct information upon revision, CJCJ cannot be responsible for data reporting errors made at the county, state, or national level.
Contact: For more information about this topic or to schedule an interview, please contact CJCJ Communications at (415) 621‑5661 x. 103 or cjcjmedia@cjcj.org.
- 1 Part of this decline is due to raising the old, 1982 felony threshold from $400 to $950, in 2010, a correction for inflation, which previously had boosted former misdemeanors to felonies. ↩
- 2 Larceny/theft and its subcategories, shoplifting, non-residential burglary, and thefts from vehicles often referred to as “smash and grab,” all of which include both felony and misdemeanor offenses. ↩
- 3 These offenses are not always customer or outsider crimes; a major retail research agency found that just 37% of retail theft is due to shoplifting, while 54% is due to employee theft and “process and control failures” (theft during storage or transfer, vendor theft, and clerical error), and 9% is attributed to unknown causes (CapitalOne Research, 2024). ↩
- 4 These closures appear due mainly to retail over-saturation in certain areas. See, for example, a CNN analysis of urban Target closures (Matthews & Wilson, 2023). ↩
- 5 Data are for January-March 2024. The 48 cities have a total population 10.4 million. ↩